Snorql - diagnosing databases like a boss #
Imagine playing with your furry friends on a fine evening after a long productive day at work.
Suddenly your phones rings, you pick up your phone thinking..
“This must be Swiggy, I cannot wait for those burgers to be here!!”
But the world had other plans for you. ****You receive a couple of slack notifications followed by a call from the escalation team.
- The site has been loading forever for a large percentage of users
- Latencies have shot up
- Timeouts going through the roof and
Now everyone is looking at you to do some wizardry!!
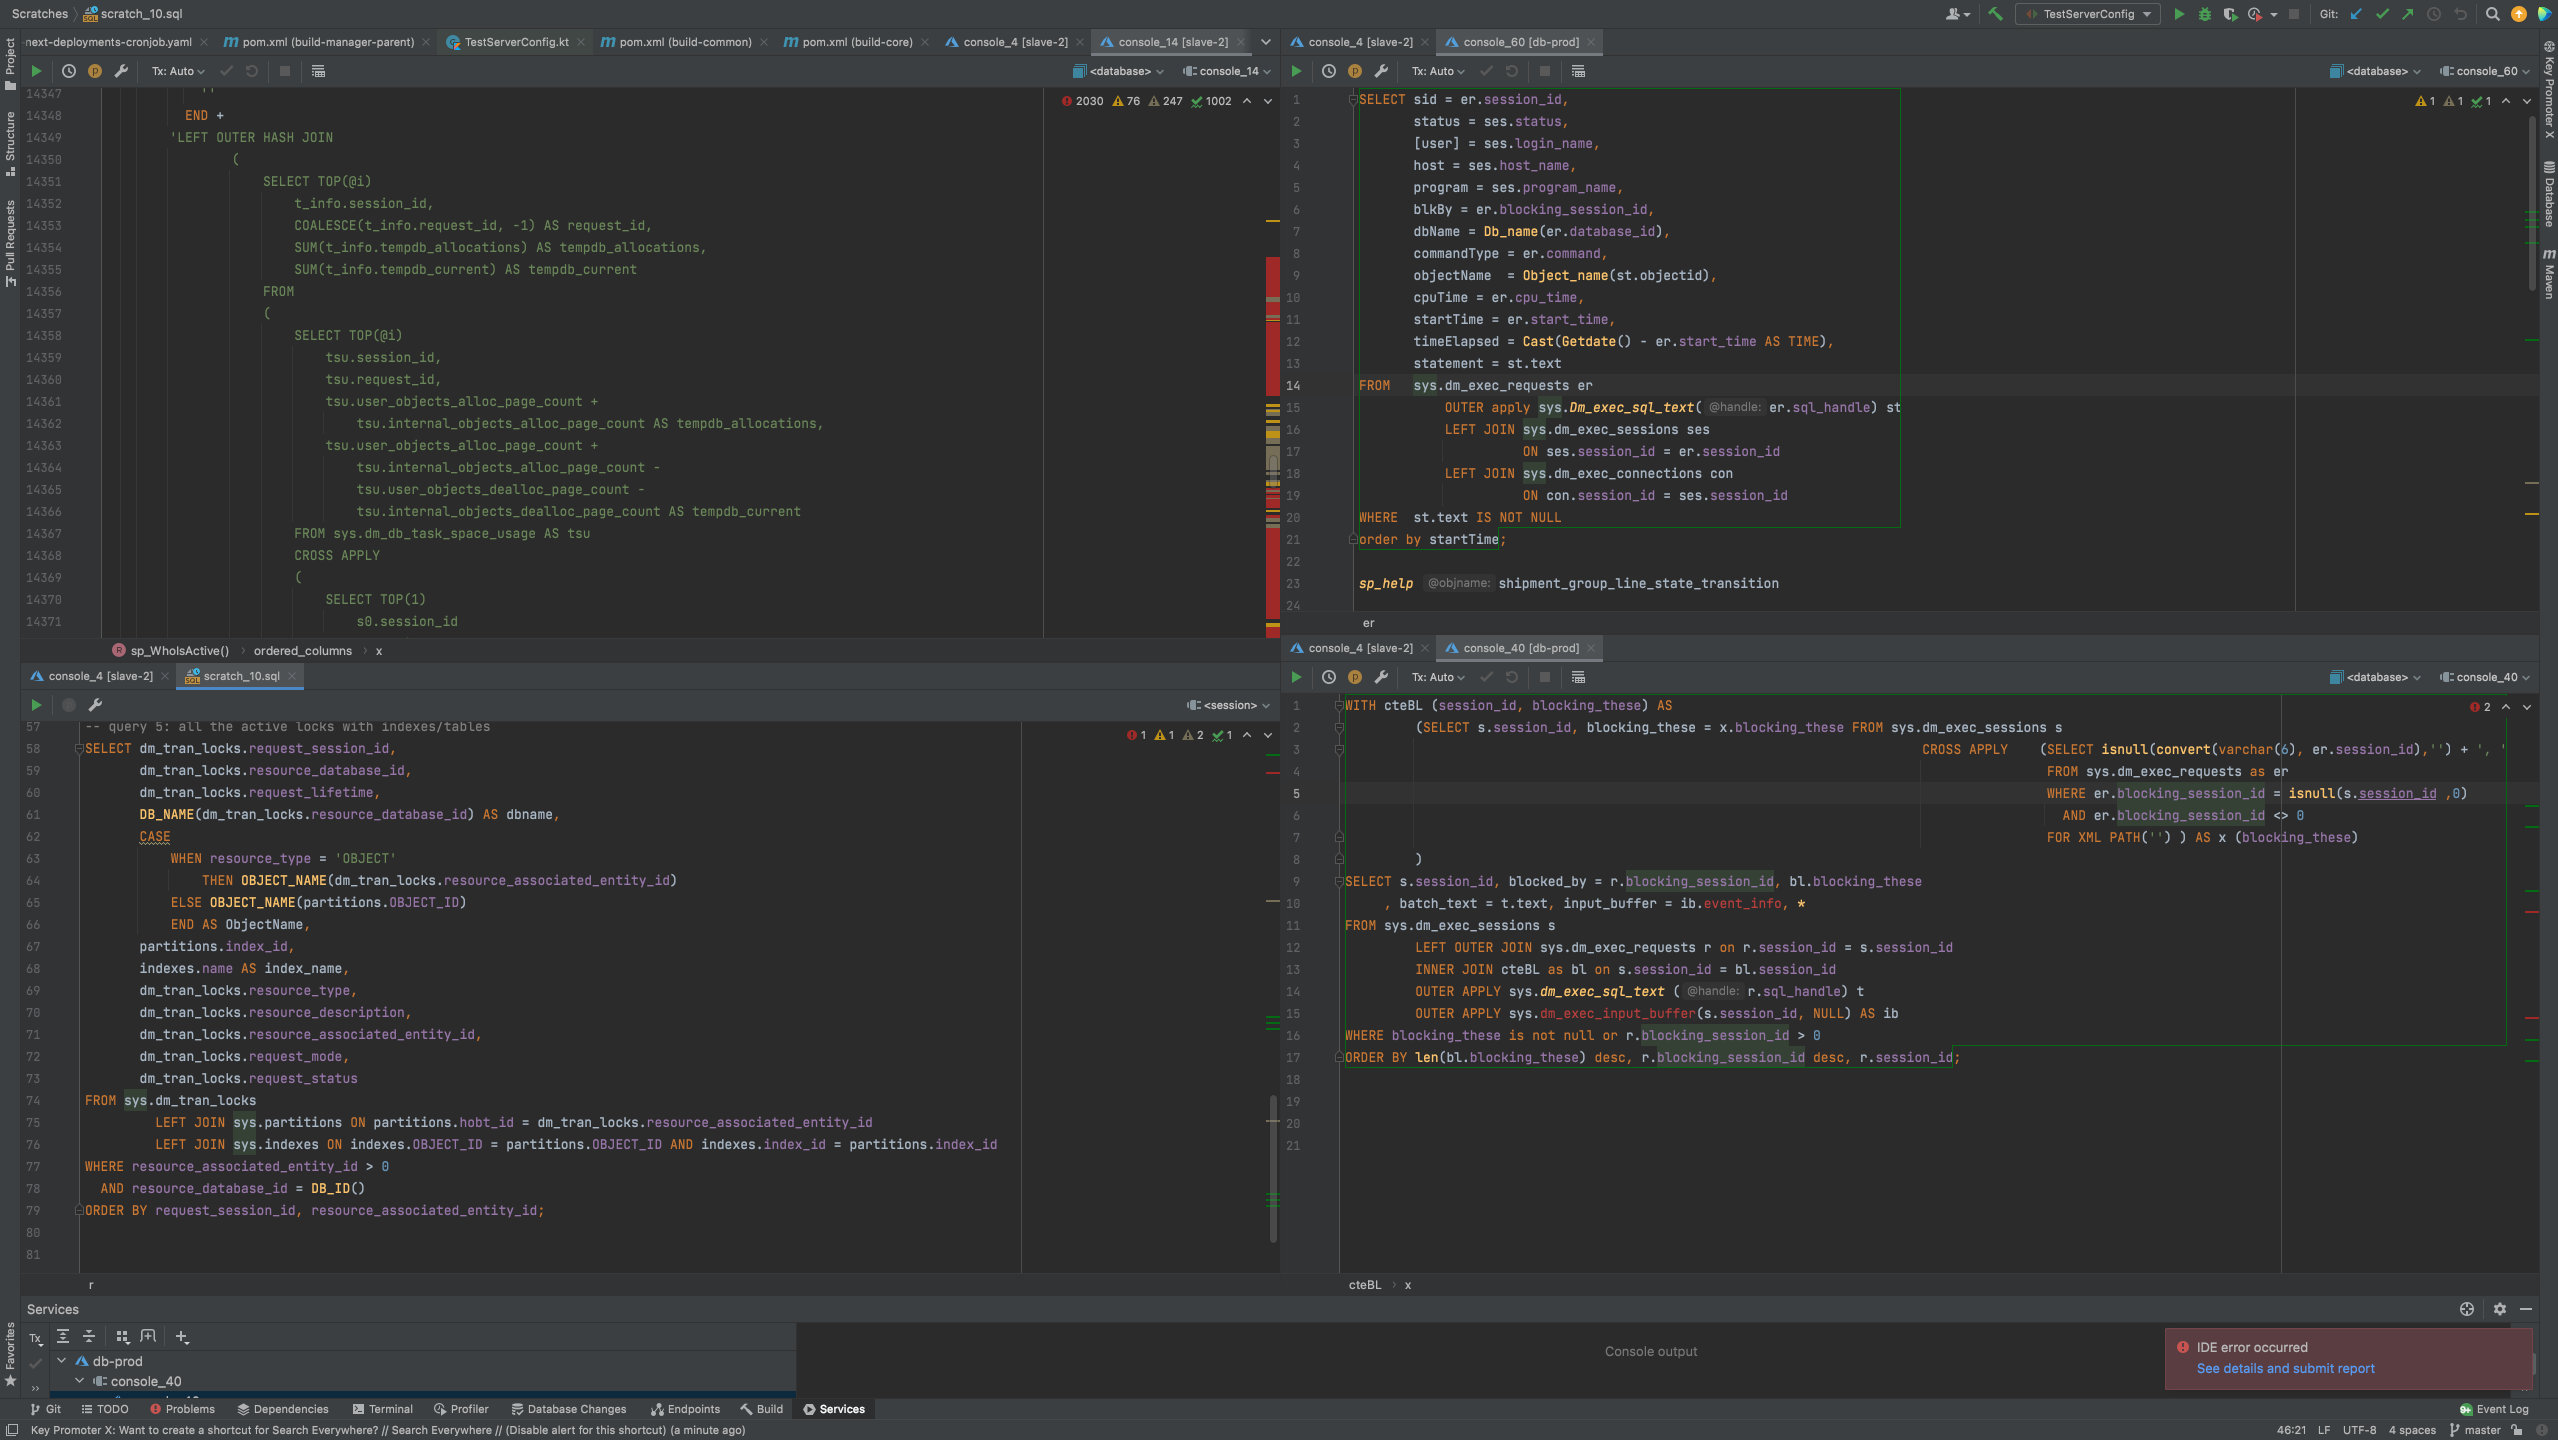
You have a magic toolbox of SQL DMV queries scattered around in your consoles. Struggling to figure out which query is going to tell you the reason of the slowness while you are staring at the computer screen.
The room starts feeling like a bomb diffuse site, with everyone’s eyes on you. Every second feels like an hour as queries are piling up, timeouts are increasing.
With your toolkit - you keep trying to look for the right queries, orchestrating runs, correlating data looking at resource health metrics, logs, active queries, locks, transactions, blocking queries & trying to make sense.
Eventually, it turns out that it was some DDL index operation hogging the CPU & blocking current transactions
You promised that once this headache is resolved, you will clean your sql cabinet, make investments for improving observability & build systems that make your life easier. Just like 100 other times, you had reminded yourself the same - but this time it is getting to your nerves.

Fuelling Motivation #
snorql took off as a project in udaan, when a few of us were just fed up with the countless number of scratch files and notes with nothing but SQL queries.
Each one is slightly different from the other. And yet, all of those SQL queries were written (in most cases, copied 😅) for a specific kind of monitoring / debugging operation on SQL server.
“Problems are nothing but wake-up calls for creativity” – Gerhard Gschwandtner

At every debugging session due to SQL performance degradation, we realised that we were exchanging queries from our personal repository and then orchestrating some set of queries to identify certain patterns.
If this is your life - I understand your pain
Solution #1 #
Our first solution was to create a notion page having collection of all the commonly used sql queries used for performance monitoring, diagnostics, gotchas etc.
This certainly did help with the knowledge transfer and making sure everyone has access to commonly used queries, but news flash!! It had some problems -
- As the number of queries grew, it became increasingly confusing to look for the right query.
- Requires spawning a console and copy-pasting a bunch of queries from doc to console for each debugging session.
- The result sets from the queries are not always perfect for a quick analysis and often require extensive eyeballing of lots of data. This can be made simpler by post-processing the result set in a high level programming language like Java.
- No easy way to provide key actionables/recommendations based on the query output.
Solution #2 #
snorql - The SQL Diagnostician we all deserve! #
Given all the limitations of maintaining a central repository of queries, we decided to build a dashboard through which we can monitor common metrics on demand.
We started with Active Running Queries and then kept adding more.
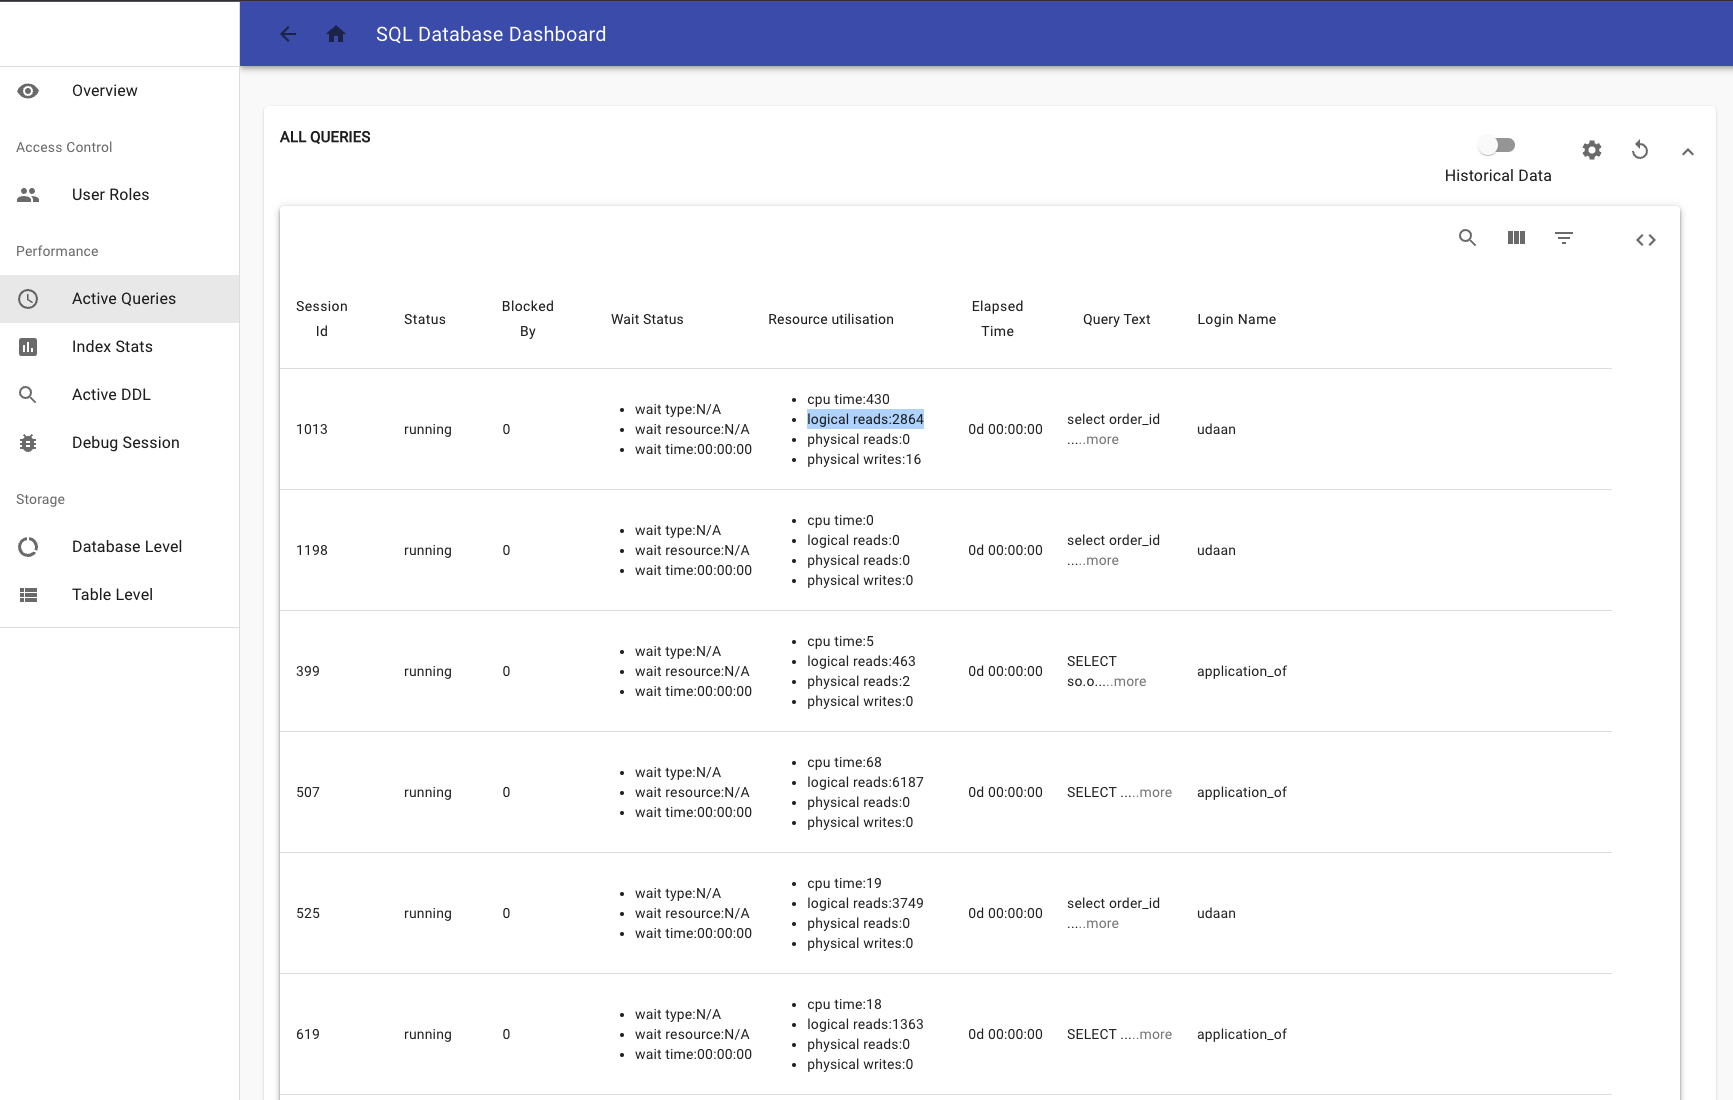
SQL Diagnostics & Monitoring Dashboard at Udaan built using snorql
We could immediately see some patterns that could neatly fit into well-defined interfaces. We started abstracting out metric inputs, outputs, configs, connections & even execution contexts and separating it from concrete implementations of the same.
These abstract classes and interfaces served as a blueprint for all the queries that we added to the dashboard. With that in place, adding a new metric was as easy as writing an implementation of the interface, and you have another executable metric. This led to the inception of snorql.

Inception of snorql
What is snorql anyways? #
snorql is an open-source project developed at Udaan aimed at monitoring & diagnosing database-related problems using SQL metrics.
It is an extensible & easy to use framework through which you can achieve all your monitoring and diagnostic goals regardless of what your database stack looks like. It provides a solid skeleton for laying down your SQL server metrics collection & provides flexibility in terms of choosing the database, database library, connection, metrics, configuration & storage engine. With this foundation, you can choose from a set of metrics which are already present or rollout a new implementation of metric which you think is useful.
We sub-divided it into two sub-modules:
1. snorql-framework #
This contains a set of interfaces, abstract classes and the glue logic which serves as the foundation of any metric that needs to be added. This is independent of any specific SQL database, driver or flavour - and can be used as an underlying metrics framework for any relational database due to its extensive nature. This does not come with any metrics as we wanted to keep it lean without introducing any specific dependencies.
Now, we never want to be in a state where queries are being piled up blocked by certain long running session & having no clue of what is happening to the database. So, we implemented BlockedQueriesMetric using snorql-framework.
The framework gave us a structured approach towards building a metric encapsulating all the details starting from preprocessing, executing, post-processing to deriving inferences all packed together to return an insightful & actionable result.
This was an easy breezy task as the framework provides the outline for implementing any metric, see here . We added necessary queries & post-processing logic as follows and Voila!
{
	"performance_blockedQueries": {
    "queries": {
      "main": "WITH ctebl (session_id, blocking_these)\nAS (SELECT s.session_id,\nblocking_these = x.blocking_these\nFROM   sys.dm_exec_sessions s\nCROSS apply (SELECT Isnull(CONVERT(VARCHAR(6),\ner.session_id), '')\n+ ', '\nFROM   sys.dm_exec_requests AS er\nWHERE  er.blocking_session_id =\nIsnull(s.session_id, 0)\nAND er.blocking_session_id <> 0\nFOR xml path('')) AS x (blocking_these))\nSELECT s.session_id,\nblocked_by = r.blocking_session_id,\nbl.blocking_these,\nbatch_text = t.text,\ninput_buffer = ib.event_info,\ns.login_name,\nr.status,\nr.wait_type,\nr.wait_resource,\nCONVERT(VARCHAR, Dateadd(ms, r.wait_time, 0), 8)            AS\n'wait_time',\ns.cpu_time,\ns.logical_reads,\ns.reads,\ns.writes,\ns.host_name,\ns.program_name,\ns.host_process_id,\ns.login_time,\ns.last_request_end_time,\ns.open_transaction_count,\nr.command,\nCONVERT(VARCHAR, (r.total_elapsed_time/1000 / 86400))\n+ 'd '\n+ CONVERT(VARCHAR, Dateadd(ms, r.total_elapsed_time, 0), 8) AS\n'elapsed_time'\n,CAST((\n'<?query --  ' + CHAR(13) + CHAR(13) + Substring(t.TEXT, (r.statement_start_offset / 2) + 1, (\n(\nCASE r.statement_end_offset\nWHEN - 1\nTHEN Datalength(t.TEXT)\nELSE r.statement_end_offset\nEND - r.statement_start_offset\n) / 2\n) + 1) + CHAR(13) + CHAR(13) + '--?>'\n) AS XML) AS 'query_text',\n\nCOALESCE(Quotename(Db_name(t.dbid)) + N'.'\n+ Quotename(Object_schema_name(t.objectid, t.dbid))\n+ N'.'\n+ Quotename(Object_name(t.objectid, t.dbid)), '')  AS\n'stored_proc'\nFROM   sys.dm_exec_sessions s\nLEFT OUTER JOIN sys.dm_exec_requests r\nON r.session_id = s.session_id\nINNER JOIN ctebl AS bl\nON s.session_id = bl.session_id\nOUTER apply sys.Dm_exec_sql_text (r.sql_handle) t\nOUTER apply sys.Dm_exec_input_buffer(s.session_id, NULL) AS ib\nWHERE  blocking_these IS NOT NULL\nOR r.blocking_session_id > 0\nAND r.wait_type NOT LIKE 'SP_SERVER_DIAGNOSTICS%'\nAND r.session_id != @@SPID\nORDER  BY Len(bl.blocking_these) DESC,\nr.blocking_session_id DESC,\nr.session_id; "
    },
    "supportsHistorical": true,
    "persistDataOptions": {
      "minimumRepeatInterval": 30
    },
    "supportsRealTime": true,
    "isParameterized": false,
    "referenceDoc": [],
    "description": ""
  }
}
class BlockedQueriesMetric :
    IMetric<BlockedQueriesInput, BlockedQueriesResult, IMetricRecommendation> {

    override fun getMetricResult(
        metricInput: BlockedQueriesInput,
        metricConfig: MetricConfig
    ): BlockedQueriesResult {
        val query =
            metricConfig.queries["main"]
                ?: throw SQLMonitoringConfigException("SQL config query [main] not found under config [${metricInput.metricId}]")
        val results = SqlMetricManager.queryExecutor.execute<BlockedQueriesDTO>(metricInput.databaseName, query)

        for(result in results) {
            if(result.blockedBy != 0){
                generateBlockingTree(result, results)
            }
        }
        val treeResults = results.filter { it.blockedBy == 0 }
        return BlockedQueriesResult(treeResults)
    }

    override fun getMetricResponseMetadata(
        metricInput: BlockedQueriesInput,
        metricOutput: MetricOutput<BlockedQueriesResult, IMetricRecommendation>
    ): Map<String, Any>? {
        val responseMetadata = mutableMapOf<String, Any>()
        val metricConfig = getMetricConfig(metricInput.metricId)
        val query = metricConfig.queries["main"]
        responseMetadata["underlyingQueries"] = listOf(query)
        responseMetadata["referenceDocumentation"] = metricConfig.referenceDoc
        responseMetadata["description"] = metricConfig.description
        responseMetadata["supportsHistorical"] = metricConfig.supportsHistorical
        responseMetadata["minimumRepeatInterval"] = metricConfig.persistDataOptions?.get("minimumRepeatInterval") ?: ""

        return responseMetadata
    }

    private fun generateBlockingTree(result:BlockedQueriesDTO, results:List<BlockedQueriesDTO>): BlockedQueriesDTO?{
        if (result.blockedBy != 0){
            if (!results.single { it.sessionId == result.blockedBy }.blockingTree.any{ it?.sessionId == result.sessionId})
            {
                results.single { it.sessionId == result.blockedBy }.blockingTree.add(result)
            }
            generateBlockingTree(results.single { it.sessionId == result.blockedBy }, results)
        }
        return result
    }

    override fun saveMetricResult(metricInput: MetricInput, result: IMetricResult) {
        // Logic to persist the [result] data object to your data store
        TODO("Implement this")
    }

    override fun getMetricRecommendations(
        metricInput: MetricInput,
        metricResult: IMetricResult
    ): IMetricRecommendation? {
        // Logic to figure out specific actionables & suggestions that can be taken considering the input & resultset.
				TODO("Implement this")
    }
}
With blocked queries metric as part of our metric repository, we added an UI on top of it. Never again did we struggled to figure out the blocking queries hierarchy.

Blocked queries visualization powered by snorql
System degradations due to blocking queries went down, and we got a box of doughnuts for this contribution from the developers.

2. snorql-extensions #
While you can build your own metrics, we have spent some time packaging some of it we found really useful into a module snorql-extensions.
It is built on top of snorql-framework, and contains implementations for commonly used metrics for debugging/monitoring purposes specifically for SQL server.
While SQL server is one of the databases that just works out of the box - querying system views for meta information or debugging use cases can be a gruelling task. Thus sophisticated queries are required for specific use cases.
This extensions library uses highly customised DMV queries and stored procedures to query data from SQL server, use post-processing for filtering/cleaning the data and adds recommendations on top of it all to make the insights actionable.
Some of the prominent metrics included are -
- Performance Metrics
- Active Queries
- Blocked Queries
- Long-running Queries
- IndexStats
- ActiveDDL
- Storage Metrics
- Database Size
- Database Tables Size
- Database Index
- Database Growth
- Table Size
- Table Unused Index
- Persistence Version Store
The Aftermath: #
After we built our own savior “snorql”, developers were empowered enough to diagnose SQL issues early on that stopped causing havoc. Awareness to follow best practices increased and we could once again go back to playing with our pets carefree.
We realised that the problem we were able to address using snorql is common across organisations, and decided to open source these modules so that more folks can benefit from our learnings and contributions.
Future of snorql #
Our vision is to make snorql the only solution you’ll ever need for monitoring & diagnosis of any relational database. We are consistently researching & analysing for potential capabilities, features or ideas that can help developers have better visibility of their SQL database.
We are in a process of shipping a few key capabilities in the upcoming months like:
-
Historical metrics
With laying down a persistence framework for storage of metrics, we want to extend querying capabilities by storing result set of a query output periodically and allowing users to revisit past data. This will help in postmortems, triaging issues & finding anomalies.
-
Alerting
Capturing metrics is a ladder on top of which we can add proactive alerting rules. We are currently working on an alerting framework through which alerting rules can be configured based on which certain alerts will be triggered.
If you have ideas, feature requests, or suggestions that can help with this vision - please feel free to raise an issue on github with the appropriate label.
Also, we love community contributions and would encourage folks to contribute in any way possible, you can find the contributing guidelines on our github repo.